Nancy Wittenberg - Realtor® GRI,ABR,SRS,PSA,CNE,AHWD


PRIVACY POLICY
Phoenix Housing Market Update: Home Prices Drop 3.8% as Buyers Gain the Advantage
.png)
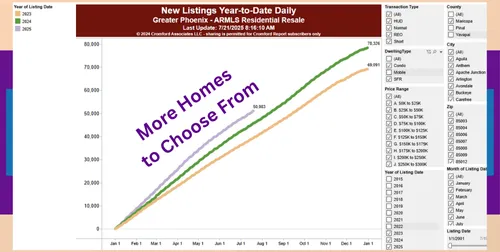
Home Buyers - You are well in the lead!!!
For the monthly period ending July 15, the price per sf ($/SF) of sold homes are down 3.8% from the $299.96 we now measure for June 15.This significant decline was unexpected. A combination of seasonal effects and the buyer's market conditions is causing pricing to weaken noticeably.
Although the Cromford� Market Index for all areas & types is now rising slowly, it remains well below 75, indicating a downward trend for prices overall.Thus the forecast for flat pricing over the next month merely represents a pause after the sharp decline between June and July.
The Cromford Report's expectation is that pricing will decline again between August and September.
.png)
Home Sellers - Your Time Will Come Again...just not for a bit.
.png)
As you can see in this chart,there hasn't been as few as 7100 homes sold by this time of the year since before 2011. Just think about how much we have grown as a county in that time.
On July 15, the pending listings for all areas and types suggest that closed prices are likely to stabilize during the next 4 to 5 weeks.
The average $/SF for active listings is on a strong downward trend, losing another 3.5% over the last month.

My Thoughts - Summary
Buyers continue to have the lion's share of the power and are expected to keep for a bit longer. This, too, shall pass. I just hope it isn't an ugly feeding frenzy when the dam finally breaks.
What do you think will happen in the fall?
Nancy Wittenberg


Search
CITIES
Resources
ABOUT
© Copyright 2026. Nancy Wittenberg. All Rights Reserved.
Follow Us On:
Meet The Team
Blog
Featured Listings
Sell Your Home
Buy A House
Search Homes
Follow Us On: